Introduction
Whether you’re tracking sales, creating budgets, managing inventory, or analyzing business data, adding a Total Row in Microsoft Excel is one of the easiest ways to summarize information. Instead of manually writing formulas at the bottom of your worksheet, Excel provides a built-in Total Row feature that can automatically calculate totals, averages, counts, maximum values, and more.
The Total Row is especially useful when working with Excel Tables because it updates automatically as you add or remove data. This saves time, reduces errors, and makes spreadsheets easier to read.
In this guide, you’ll learn multiple ways to add a Total Row in Excel, including using the built-in Table feature, AutoSum, and manual formulas. You’ll also discover common problems, troubleshooting tips, and best practices for creating professional spreadsheets.
Quick Answer (Featured Snippet)
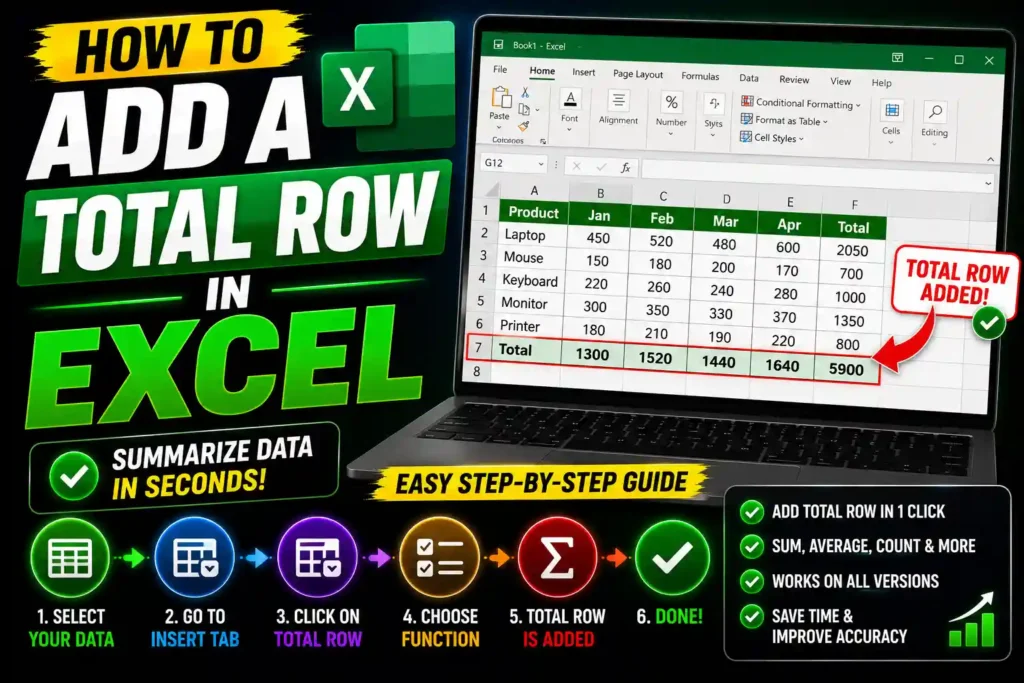
To add a Total Row in Excel:
- Select any cell within your data.
- Press Ctrl + T to convert the range into a Table (or choose Insert > Table).
- Click anywhere inside the table.
- Open the Table Design (or Table) tab.
- Check the Total Row option.
- Excel adds a Total Row at the bottom of the table.
- Click a Total Row cell and choose a calculation such as Sum, Average, Count, Max, or Min from the drop-down list.
Table of Contents
- What Is a Total Row in Excel?
- Benefits of Using a Total Row
- How to Add a Total Row
- Other Ways to Calculate Totals
- Common Errors and Fixes
- Best Practices
- FAQs
- Conclusion
What Is a Total Row in Excel?
A Total Row is a special row that appears at the bottom of an Excel Table. It automatically performs calculations for selected columns without requiring you to write formulas manually.
Depending on your needs, the Total Row can display:
- Sum
- Average
- Count
- Count Numbers
- Maximum
- Minimum
- Standard Deviation
- Variance
Unlike regular formulas, the Total Row automatically adjusts when new rows are added or existing rows are removed from the table.
Why Use a Total Row?
Adding a Total Row offers several advantages:
- Saves time by using built-in calculations.
- Updates automatically as your data changes.
- Reduces formula errors.
- Makes reports easier to understand.
- Works well with filters and sorting.
- Ideal for financial reports, budgets, inventory, and sales tracking.
Step-by-Step Guide
Method 1: Add a Total Row Using an Excel Table
This is the easiest and most recommended method.
Step 1: Select Your Data
Highlight your dataset, including column headers.
Example:
| Product | Quantity | Price |
|---|---|---|
| Mouse | 15 | $20 |
| Keyboard | 8 | $35 |
| Monitor | 5 | $180 |
Step 2: Convert the Range into a Table
You can do this in either of two ways:
- Press Ctrl + T, or
- Go to Insert > Table.
Ensure the My table has headers option is checked if your data includes column headings.
Click OK.
Step 3: Enable the Total Row
- Click anywhere inside the table.
- Open the Table Design (or Table) tab on the Ribbon.
- In the Table Style Options group, check Total Row.
Excel immediately inserts a new row at the bottom of the table.
Step 4: Choose a Calculation
Click a cell in the Total Row under the column you want to summarize.
A drop-down arrow appears.
Select one of the available functions, such as:
- Sum
- Average
- Count
- Count Numbers
- Maximum
- Minimum
Excel inserts the appropriate formula automatically.
Method 2: Use AutoSum
If your data isn’t formatted as a table, AutoSum provides a quick alternative.
Step 1
Click the empty cell directly below the column of numbers.
Step 2
Go to the Home tab or the Formulas tab.
Step 3
Click AutoSum (Σ).
Excel automatically selects the range of numbers above.
Step 4
Press Enter.
Your total appears instantly.
Method 3: Enter a SUM Formula Manually
If you prefer writing formulas yourself:
=SUM(B2:B15)Replace the cell range with the actual range in your worksheet.
You can also use:
=AVERAGE(B2:B15)=COUNT(B2:B15)=MAX(B2:B15)=MIN(B2:B15)These formulas provide flexibility for customized reports.
Method 4: Add Totals for Multiple Columns
If your table includes several numeric columns:
- Enable the Total Row.
- Click each Total Row cell individually.
- Select the desired calculation for each column.
For example:
| Quantity | Price | Sales |
| Sum | Average | Sum |
Each column can use a different calculation depending on your reporting needs.
Common Errors and Fixes
Total Row Option Is Missing
Cause
Your data isn’t formatted as a table.
Fix
Convert the range into a table using Ctrl + T.
SUM Returns Zero
Cause
The values are stored as text rather than numbers.
Fix
Convert text values to numbers using Convert to Number or adjust the cell format.
Formula Doesn’t Update Automatically
Cause
The data is not inside an Excel Table.
Fix
Use the built-in Table feature so the Total Row expands automatically when new records are added.
Incorrect Total
Cause
Hidden rows or filters may affect the calculation.
Fix
Review the selected function and ensure the correct cells are included.
Total Row Disappears
Cause
The Total Row option was turned off.
Fix
Select any cell in the table, go to Table Design, and re-enable Total Row.
Best Practices / Pro Tips
To make the most of Excel’s Total Row feature:
- Always convert data into an Excel Table before analyzing it.
- Use descriptive column headers.
- Keep numeric data in consistent formats.
- Avoid blank rows within your table.
- Use filters with the Total Row for dynamic summaries.
- Double-check calculations before sharing reports.
- Save your workbook frequently, especially when working with large datasets.
For more technology and productivity tutorials, check out these guides:
- How to Uninstall Microsoft Edge on Windows 11 (Step-by-Step Guide)
https://multicaretechnical.com/how-to-uninstall-microsoft-edge-on-windows-11-step-by-step-guide - How to Use Chromebook Recovery Utility (Complete Guide 2026)
https://multicaretechnical.com/ow-to-use-chromebook-recovery-utility-complete-guide-2026 - How to Delete a Snapchat Story (Step-by-Step Guide for 2026)
https://multicaretechnical.com/how-to-delete-a-snapchat-story-step-by-step-guide-for-2026
Frequently Asked Questions
1. What is a Total Row in Excel?
A Total Row is a built-in feature for Excel Tables that automatically calculates values such as Sum, Average, Count, Maximum, and Minimum at the bottom of your data.
2. Why can’t I see the Total Row option?
The Total Row feature is only available for Excel Tables. Convert your data into a table using Ctrl + T, then enable Total Row from the Table Design tab.
3. Can I use different calculations in the same Total Row?
Yes. Each column in the Total Row can use a different function, such as Sum for one column and Average or Count for another.
4. Does the Total Row update automatically?
Yes. When your data is formatted as an Excel Table, the Total Row updates automatically as you add or remove rows.
5. Can I use formulas instead of a Total Row?
Yes. You can manually use formulas such as SUM, AVERAGE, COUNT, MAX, and MIN if you don’t want to convert your data into a table.
Conclusion
Adding a Total Row in Excel is one of the simplest ways to summarize data quickly and accurately. Whether you’re managing business reports, tracking expenses, or analyzing sales figures, the built-in Total Row feature saves time by automatically calculating totals, averages, counts, and other key metrics. Because it updates dynamically as your table changes, it’s an excellent tool for both beginners and experienced Excel users.
For the best experience, convert your data into an Excel Table before enabling the Total Row, keep your data organized, and choose the calculation that best fits each column. By following the steps and best practices in this guide, you can create cleaner, more professional spreadsheets that are easier to maintain and analyze.